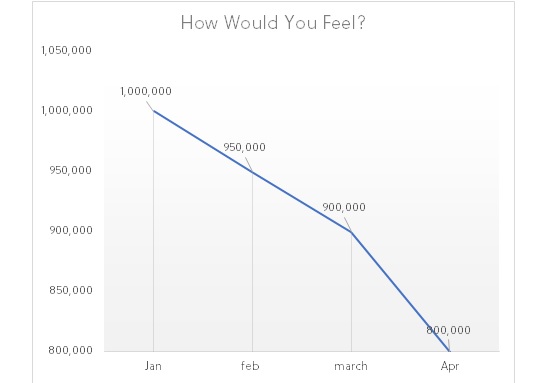
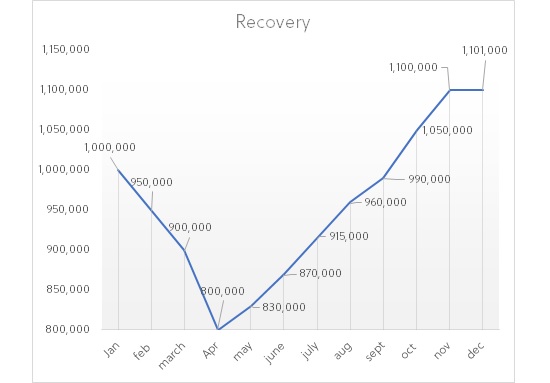
Karen and Jose each invest in the same stocks and those stocks have the monthly returns above.
Below is a chart showing the absolute returns investing in these stocks during the year.
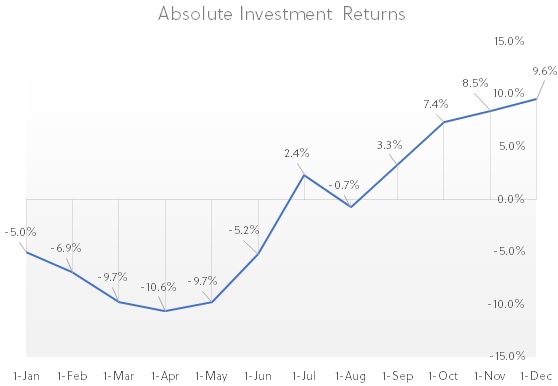
Above is an example of absolute returns - On January 1st the initial investment would have lost 5% of its beginning value, on February 1st the initial investment would have lost 6.9% of its beginning value, etc.
In the above example are the hypothetical stock market investments for both Jose and Karen. The chart shows if Karen and Jose invested at the start of the year and made no changes by the end of the year, they would end the year with a 9.6% return on their investment.
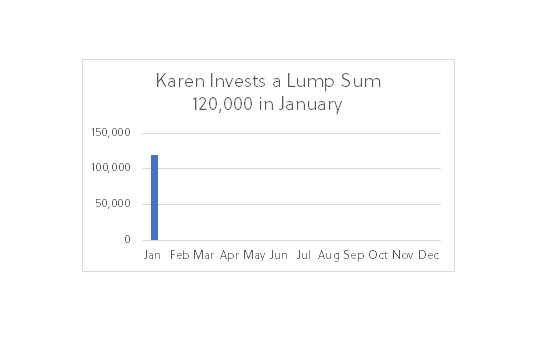
Assume Karen has PHP 120,000 to invest on January 1st. She decides to invest ALL the money on the first trading day of the year. The below chart is Karen’s PHP 120,000 invested on the first of the year.
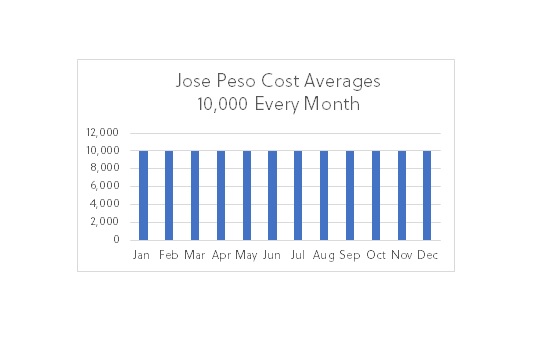
Jose, unlike Karen, decides to peso cost average his PHP 120,000 over the next twelve months. You can see Jose only added PHP 10,000 in January, then PHP 10,000 in February, etc.
If the stocks Karen invested in declined 5% in the first month, Karen’s PHP 120,000 would now be worth PHP 114,000 (a paper loss of PHP 6,000).
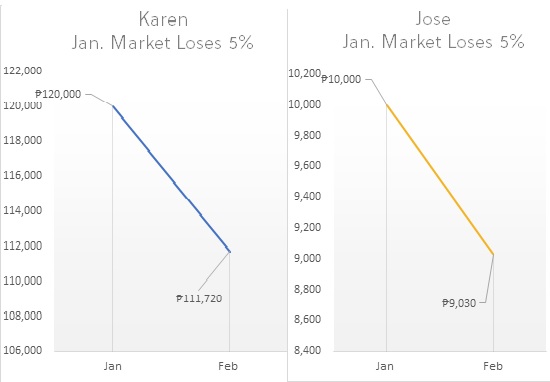
If Jose has the same 5% loss as Karen, Jose’s PHP 10,000 would be worth PHP 9,500 (a paper loss of PHP 500).
Karen and Jose both lost the same percentage in January (5%) but Karen lost more money (PHP 6,000) than Jose (PHP 500) because she had more invested. Now, things get interesting.
Jose loses a lower percentage in February thanks to peso cost averaging. In February, Karen kept her money invested, and Jose added his next PHP 10,000.
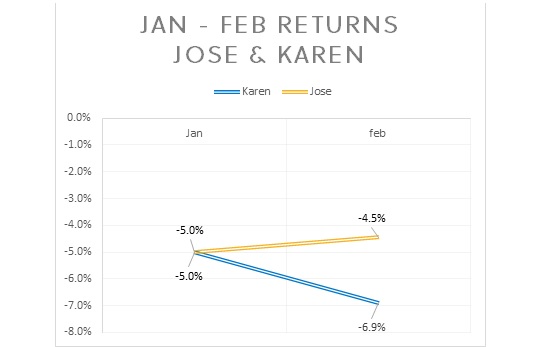
Above you can see that Karen and Jose both had a paper loss of 5% in January. However, in February, Karen had a total paper loss of 6.9% and Jose only had a total paper loss of 4.5%. So how did Jose lose less than Karen? This is because Jose was peso cost averaging. Karen was fully invested when the market lost value two consecutive months in a row. Jose lost 5% on his first PHP10,000, but he only lost 2% on his next PHP10,000 thanks to a better February return than January.
Now you understand a lump sum investment can have a different return than peso cost averaging - even if the monthly returns are the exact same.
Jose makes a better return than Karen for the year
Now let’s compare Karen’s lump sum investment to Jose’s peso cost averaging for the year.
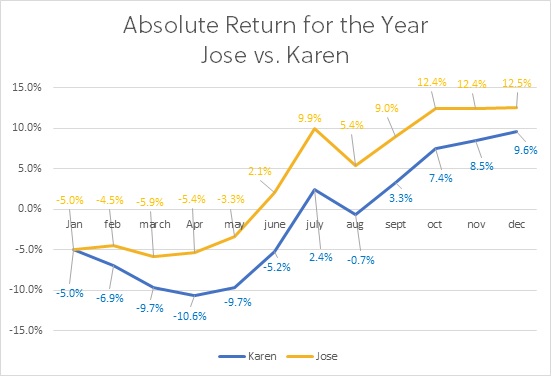
Above shows Jose made a 12.5% return for the year thanks to peso costs averaging, while Karen only made a 9.6% return for the year. This shows that peso cost averaging can help smooth the ride during a declining market.
If it were a bull market and Karen happened to invest right before the market increased in value, then she would have outperformed Jose. The fact is, nobody knows when a bull market will start and end. For this reason, peso cost averaging is the best way to smooth returns and reduce that powerful feeling of investment loss.
Let’s look at a real-world example.
Peso cost averaging using SM
We’ve learned how peso cost averaging can help reduce volatility by smoothing out returns. Now we will show a real-world example using the past performance of SM.
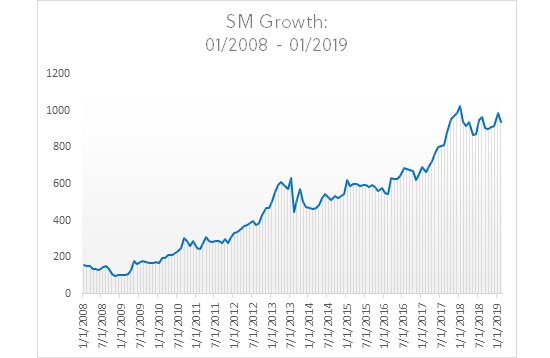
The above chart shows the closing price of SM starting in January 2008 and ending in January 2019.
If you had invested in SM on January 2008, your initial investment would have gained an absolute return of 487% by January 2019! The problem is, in January 2008, you only would have had so much money to invest in SM.
Even if you had a lump sum to invest, you are likely to make money for another 11 years that will be invested. Which means only so much money can be invested in January 2008 – a large amount of money will be invested from January 2008 onwards because you still need to make that money in the future.
Below is a chart showing the results of peso cost averaging SM.
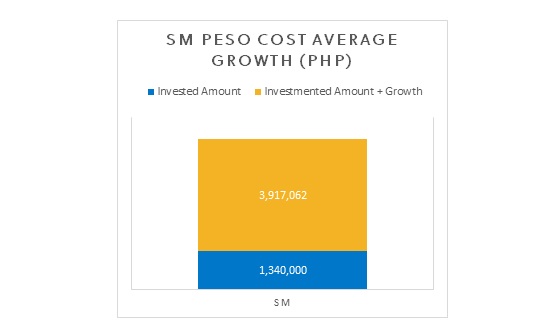
Blue - the money invested into SM; Yellow – the total value of SM stock (initial investment plus gains)
If an investor had peso cost averaged PHP 10,000 per month into SM stock from January 2008 to January 2019, the above bar chart shows they would have invested a total of PHP1,340,000 and their holdings would be worth a total of PHP3,917,062. This equals a gain of PHP2,577,062!
The next chart shows how much the growth of that PHP3,917,062 would have looked over time.
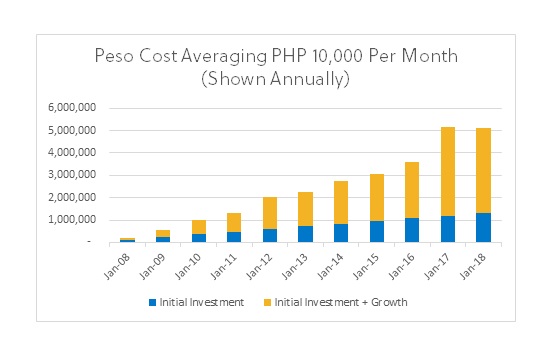
You can see that each year the amount invested increases by the same amount (blue section - PHP120,000 annually). But you may notice the yellow section of the bar chart increases much more than the initial investment. This is thanks to the investment compounding over time. One of the amazing things about peso cost averaging is investing small amounts that compound over long periods of time.
While the charts above obviously trend upward, there were periods of time when the returns of SM were flat and even declined.
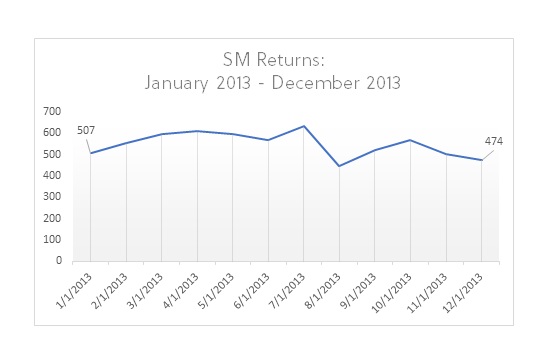
The above chart shows the return of SM from January 2013 – December 2013. If you had invested in SM during this period, you would have had had a loss of 6.5%. This goes to show that it’s impossible to time gains – SM grew over 400% from 2008 – 2019, yet there was a full year with a 6.5% decline.
Again, this is the beauty of peso cost averaging – you don’t need to time the market, you just invest consistently over long periods of time.

Conclusion – What is peso cost averaging and how does it work?
Investors feel the pain of loss twice as much as the pleasure of gain. This leads to an overreaction when your investments lose money compared to when they make money. Peso cost averaging helps smooth the feeling of loss through consistency. By consistently investing the same amount on the same date, investors can ignore stock market returns.
If the stock market has a big loss or a big gain, it should not matter to someone who is peso cost averaging. The amount of money to peso cost average is up to you – it depends on how much you have saved, and how much you can invest each month.
It may be a good idea to tie the monthly amount you invest to your income. If you can save 15% of your income then that is your number; if you can save 20% of your income that is your number.
When investing, peso cost averaging may be right for you - especially if you are investing for the long-term.
If you are ready to peso cost average and don’t have a brokerage account established, make sure you click the link below to sign up with BDO Securities. It’s time to start investing!
_______________________________________________________________________________________
Don’t have a BDO Securities account?
Click here to open a BDO Securities brokerage account in as little as 5 minutes!
_______________________________________________________________________________________


