Technical analysis is comprised of different concepts; two important concepts traders heavily rely on include pattern and trend analysis. Another important concept traders utilize are technical indicators, which are often used in conjunction with pattern and trend analysis to help firm up a trader’s views on specific stocks.
Some important indicators used by traders include:
- Moving averages
- MACD
- Parabolic SAR
- RSI
- Stochastic Oscillator
- Money Flow Index
- Bollinger Bands
Each of these indicators can be further classified as trend indicators, momentum indicators, volume indicators, and volatility indicators.
Technical Indicators (Trend)
Moving Averages
_______________________________________________________________________________________________
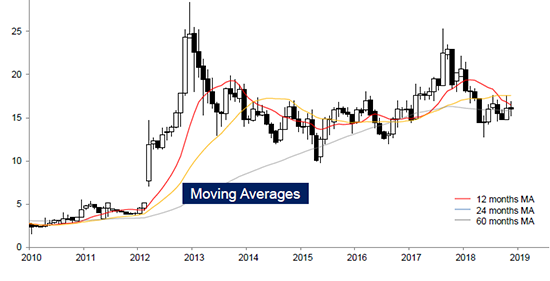
A moving average (MA) is commonly used with time series data to smooth out short-term fluctuations and highlight longer-term trends or cycles.
There are different types of moving averages including simple, weighted, exponential, and cumulative MA’s.
Statistically, the moving average is optimal for recovering the underlying trend of the time series when the fluctuations about the trend are normally distributed.
The chart above shows long-term moving averages:
Red – 12 months
Blue – 24 months
Green – 60 months
Many traders use shorter-term moving averages such as:
50-day moving average
100-day moving average
200-day moving average
Moving averages can help traders decide entry and exit points.
_______________________________________________________________________________________________
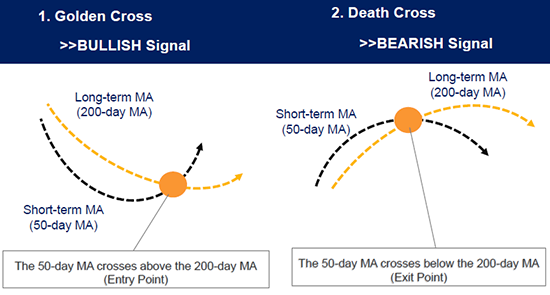
Above you can see two signals used by traders. The Golden Cross on the left is a bullish signal. This occurs when the 50-day MA crosses the 200-day MA in an upward trend. The Death Cross is a bearish signal. This occurs when the 50-day MA crosses the 200-day MA in a downward trend. These can either signal an entry point or an exit point of a position.
Moving Average Convergence Divergence (MACD)
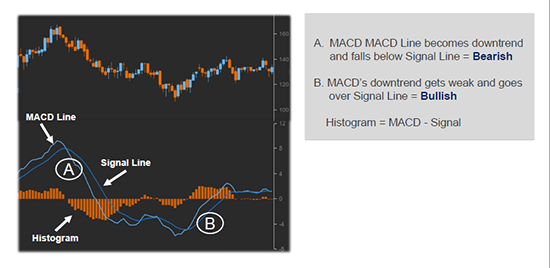
MACD is an indicator using the change in a stock's underlying price trend. The theory suggests that when a price is trending, it is expected that speculative forces "test" the trend. While the primary function is to identify turning points in a trend, the level at which the signals occur determines the strength of the reading.
When the MACD line falls below the signal line, it leads to a bearish signal (A). When the MACD line passes above the signal line it shows a bullish signal (B). The histogram helps visualize the relationship between the MACD line and signal line.
Parabolic Stop and Reverse (SAR)
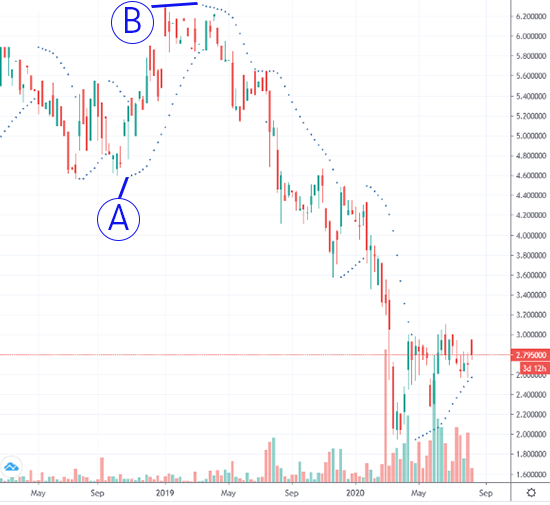
Parabolic SAR is used as a trailing stop loss based on prices tending to stay within a parabolic curve during a strong trend. The concept draws on the idea that time is the enemy (similar to option theory's concept of time decay), and unless a security can continue to generate more profits over time, it should be liquidated.
The indicator generally works well in trending markets, but provides "whipsaws" during non-trending, sideways phases; A parabola below the price is generally bullish (see “A” above), while a parabola above is generally bearish (see “b” above).
Technical Indicators (Momentum)
Relative Strength Index (RSI)
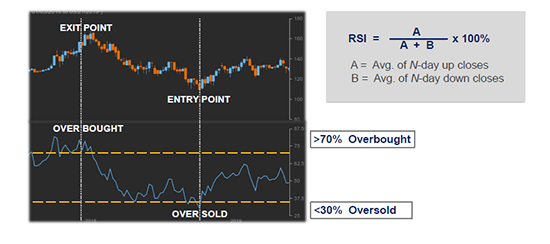
RSI is a measure of the stock's recent trading strength. When the price moves up very rapidly, at some point it is considered overbought. Likewise, when the price falls very rapidly, at some point it is considered oversold.
Tops and bottoms are indicated when RSI goes above 70 or drops below 30 (yellow dashed lines). Traditionally, RSI readings greater than the 70 level are considered to be in overbought territory, and RSI readings lower than the 30 level are considered to be in oversold territory. In between the 30 and 70 level is considered neutral, with the 50 level a sign of no trend.
Uptrends generally traded between RSI 40 and 80, while downtrends usually traded between RSI 60 and 20.
Stochastics Oscillator
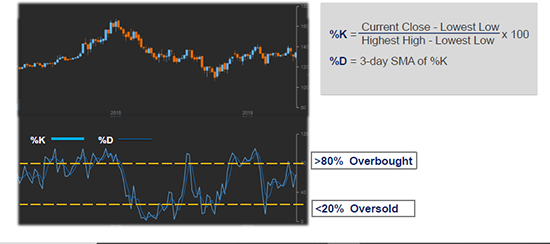
The stochastics oscillator is a momentum indicator that uses support and resistance levels. The term stochastic refers to the location of a current price in relation to its price range over a period of time.
This method attempts to predict price turning points by comparing the closing price of a security to its price range. The idea behind this indicator is that prices tend to close near the extremes of the recent range before turning. The signal to act is when you have divergence-convergence, in an extreme area.
Technical Indicators (Volume)
Money Flow Index
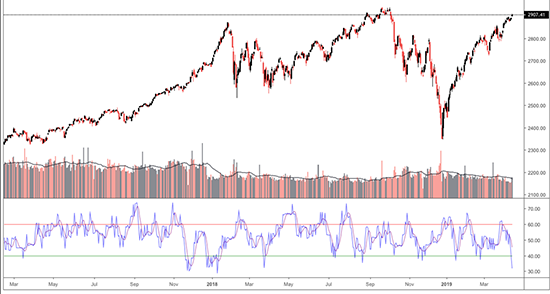
The Money Flow Index uses both price information and volume information. Like Stochastics, the Money Flow Index is an oscillator and a figure above 80 is considered overbought while a figure below 20 is considered oversold. Also similar to Stochastics, traders look for divergences between stock prices and the indicator which could be a signal.
Technical Indicators (Volatility)
Bollinger Bands
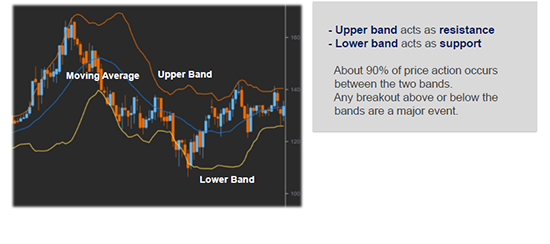
Bollinger Bands use the simple moving average along standard deviation to create a “band” which nearly 90% of stock prices trade within. The use of bollinger bands is partly reliant on the squeezing together and moving apart of the bands. A squeeze occurs when the upper band and lower band move closer together. A squeeze means lower volatility and can be a signal of future higher volatility for a stock. The moving apart of the bands shows higher volatility and can be a signal of lower volatiliy in the future.
Technical indicators are powerful tools used by traders. While technical indicators can be highly useful, they are used in conjunction with other aspects of trading; such as pattern and trend analysis. These indicators can help solidify a thesis for a trader, but are not often used solely to determine entry and exit points of trades.
We highly suggest watching our video regarding risk management here: Risk Management Video


