Chart patterns have established definition and criteria, and these patterns can help project trends in stock prices; keep in mind there are no patterns that tell you with 100% certainty the future trend of a stock price. The process of identifying chart patterns based on these criteria can be subjective in nature, which is why charting is often seen as more of an art than a science.
The two most popular chart patterns are reversals and continuations. A reversals signals that a prior trend will reverse (breakout) upon completion of the pattern, while a continuation pattern signals that the trend will continue once the pattern is complete. These patterns can be found across any timeframe.
This article will be discussing bullish and bearish reversal patterns.
Bullish Reversals

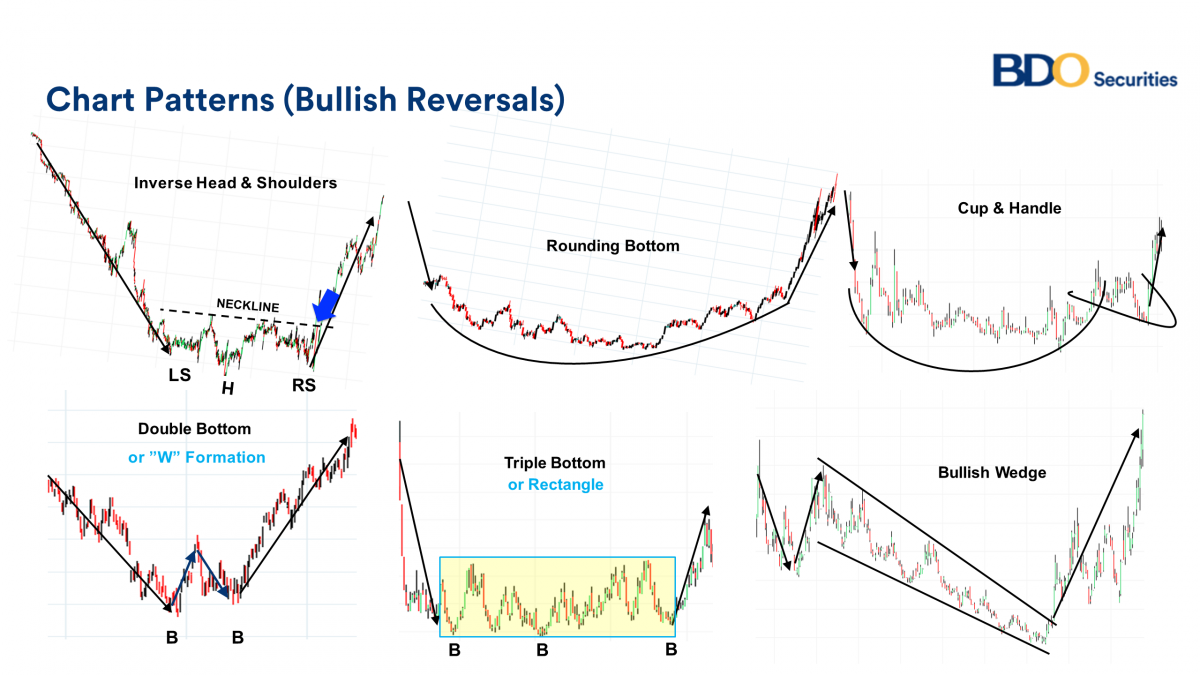
There are five main bullish reversal patterns seen above. You may notice that bullish reversal patterns begin with a bearish price movement that reverses to an increase in the stock price. This is because the bearish trend of the stock price is reversing, leading to an uptrend in the stock.

The double bottom (and the triple bottom) are patterns wherein the price of a stock will hit a bottom two (or three) times before leading to a breakout. The double and triple bottom patterns have a neckline that can be drawn from the highest point after the first bottom (and second bottom for triple bottoms).

An inverted head and shoulder resembles an upsidedown head with two shoulders (see below head and shoulders to better see the image of a head with two shoulders). An inverted head and shoulders pattern has the head as the lowest point and two shoulders with a neckline. The height from the neckline to the head is used to create a bullilsh price target. The distance from the head to the neckline is used as the upward price target.

A falling wedge (also known as a bullish wedge) shows a pattern wherein the distance between the highs and lows are declining, leading to a wedge-like pattern. As the distance between the highs and lows is compacting in a downward pattern, it leads to a consolidation in the price action. Eventually, if the stock breaks the downtrend line (the line on top in the above graphic) the stock can breakout, which is why this is a bullish reversal (the stock is reversing from a bearish pattern to a bullish pattern).

The rounding bottom is a somewhat rare pattern that begins with a bearish trending price. The price enters a prolonged consolidation phase (the bottom) which eventually turns into a bullish trend. The consolidation phase of the rounding bottom can last for weeks or months before the bullish trend begins.
Bearish Reversals

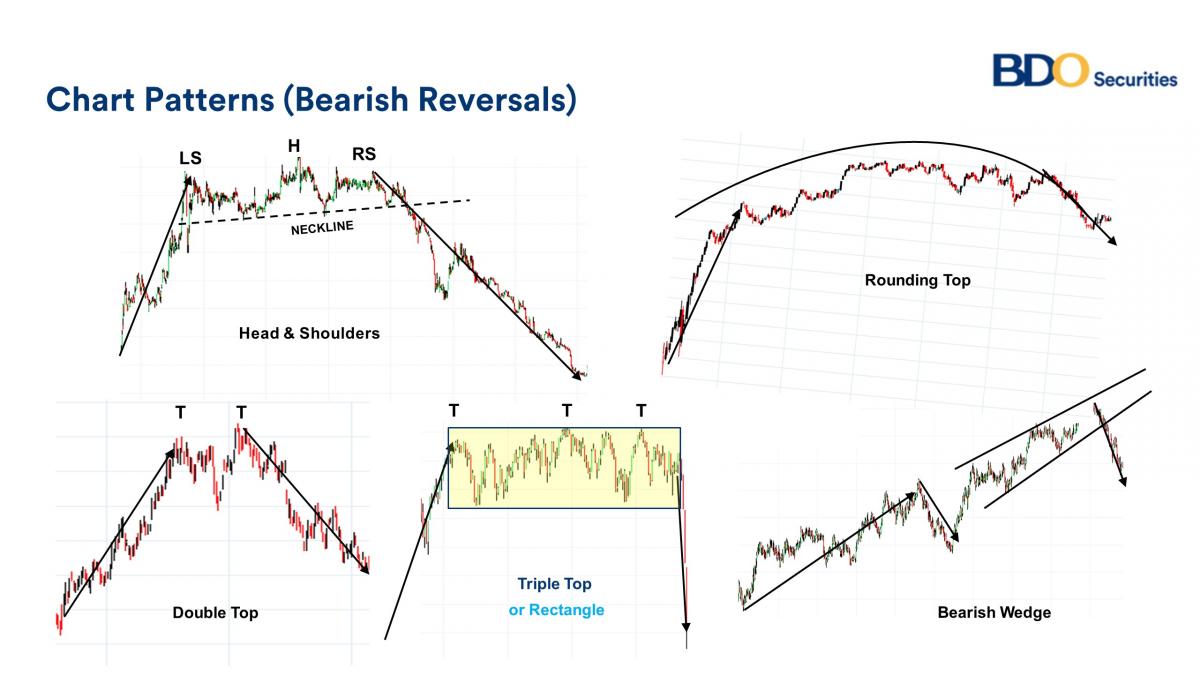
Similar to the bullish reversals, there are five main bearish reversal patterns seen above. Bearish reversals start with a bullish price movement reverses into a decreasing stock price. This is because the bullish trend of the stock is reversing, leading to a downtrend in the stock.

The double top (and the triple top) are patterns wherein the price of a stock will hit a high two (or three) times before leading to a breakdown. The double and triple top patterns have a neckline that can be drawn from the lowest point after the first top (and second top for triple tops).

The head and shoulders pattern resembles an head (peak) with two shoulders. The head is the highest point with the bottom of the two shoulders being the neckline.. The height from the neckline to the head is used to create a bearish price target. The distance from the head to the neckline is used as the downward price target.

A rising wedge (also known as a bearish wedge) shows a pattern wherein the distance between the highs and lows are declining in an upward pattern, leading to a wedge-like pattern. As the distance between the highs and lows is compacting, it leads to a consolidation in the price. Eventually, if the stock breaks the downtrend line (the line on the bottom in the above graphic) the stock can breakdown, which is why this is a bullish reversal (the stock is reversing from a bullish pattern to a bearish pattern).

The rounding top is a somewhat rare pattern that begins with a bullish trending price. The price enters a prolonged consolidation phase (the top) which eventually turns into a bearish trend. The consolidation phase of the rounding bottom can last for weeks or months before the bullish trend begins.
We highly suggest watching our video regarding risk management here: Risk Management Video


