Considering where the Philippine economy and Asia are situated right now, the market has been talking about companies with attractive valuation.
Valuation? What is this, and how can we determine whether or not a company is currently trading at good value?
This article is written to better educate you regarding stock valuation and the common methodologies we use here at BDO Securities. We will be covering everything from PE ratio and dividend discount model, to discounted cash flow (DCF), EV/EBITDA, and sum-of-the-parts (SOTP) valuation.
This article discusses one of the most well-known stock market financial metrics around the globe, the price to earnings ratio (PE ratio). Whether you’re watching Bloomberg News Asia, CNBC in the United States, or the local, Market Edge, you’ll likely hear the words “PE Ratio” peppered throughout the programs.
A PE ratio can be helpful when it comes to evaluating whether or not to purchase a stock. You may want to consider the following assessment methodologies to evaluate a stock using PE ratio:
- Compare a company’s current PE ratio to its historical and/or projected PE ratios.
- Compare a company’s current PE ratio with its closest peers or competitors.
- Compare a company’s current PE ratio with its industry sector, or the index if the company is an index stock.
Keep reading to learn how to use PE ratios and these three (3) proposed applications.
*Note that the examples and methodologies below are more in line with that of a value investing approach to investing.
Stock PE Ratio Example
Before we discuss the three (3) methodologies mentioned above, let us go over an example of a PE ratio using Shakey’s Pizza Asian Ventures Inc. (stock symbol PIZZA).
The PE ratio is derived through the use of two simple numbers:
- Stock Price
- Earnings Per Share
To calculate a PE Ratio, all you need to do is divide the Stock Price by the Earnings Per Share of a specific stock.
The earnings per share (EPS) of PIZZA was P0.47* (April 21, 2020).
*For reference, a company’s EPS can be found in our coverage reports.
The PE ratio of PIZZA is as follows:
- Share price of company’s stock / earnings per share of company’s stock = PE Ratio
- P5.84/P0.47 = 12.4x
- The P/E ratio of PIZZA is 12.4x
One way to think of this 12.4x is that investors are paying 12.4x times more than PIZZA’s current earnings for the stock.
Here’s an easier example to help you grasp the PE ratio:
Imagine you want to buy a restaurant from a family friend. How much do you decide to pay for the restaurant? Well, one way is to look at the earnings of the restaurant. But it is not enough to know the current earnings. You will need to assess how much more earnings can the company generate in the future and how much more value-added service the company is going to generate for you. All the information and assumptions must be included in your valuation model. Therefore, notice that your PE ratio (or valuation of the company) is never only 1x or 2x; it’s normally higher. Like in the case of PIZZA, it’s 12.4x – what a premium! So, if a restaurant makes a P5,000,000 annual profit (earnings) and you decide to pay 12.4x that profit, it is equivalent to paying P62,000,000 for a restaurant that earns only P5,000,000 per year.
Sounds a lot right? So how do we make sure that we limit the risk of overpaying for a certain company?
The next topic will discuss the three (3) proposed methodologies which we believe will help us understand the relevance of the PE ratio and how it can help us decide if PIZZA is a buy or not.
1 - Compare a company’s current PE ratio to its historic PE ratio (and forecasted PE ratio if applicable).
The past average PE ratios of PIZZA are:
1 2019 Average PE Ratio = 20x
2 2018 Average PE Ratio = 23x
With these historic PE ratios in mind, we can now ask some questions about PIZZA as a business.
1 Will the business model of PIZZA remain intact after COVID-19?
2 Will the company return to its previous profitability and grow earnings in the mid to long-term?
If you believe PIZZA will return to previous profitability at 20x to 23x, then buying it today at 12.4x is considered cheap and may be worth the buy.
In some situations, you will find forecasted PE ratios in areas such as the BDO Securities coverage reports. When available, these forecasted PE ratios may help you better evaluate a stock.
So, is PIZZA a buy or not?
When it comes to PE ratios, comparing current numbers to historical numbers (and forecasted numbers if applicable) may help distinguish if today’s PE ratio is low or high.
But it may not be enough to simply compare the stock with its historical PE because we are comparing PIZZA only with itself. What if there are other businesses out there with similar business models as PIZZA but are trading at a lower PE ratio than PIZZA. This factor can influence your decision to buy or forego PIZZA as well.
2 -Compare a company’s current PE ratio to its closest competitors
To compare PIZZA to potential peers, we may be able to view the PE ratios of Max’s Group Inc. (MAXS) and Jollibee (JFC). According to Bloomberg:
1 MAXS has a PE ratio of 7.2x
2 JFC has a PE ratio of 23.5x.
For this consideration, you would need to make a decision whether PIZZA is a better company to purchase than MAXS and JFC by simply using the current PE ratios.
3- Compare a company’s current PE ratio to the sector it belongs to, or the PSEi if it is an index stock.
In case we are unable to find a similar peer or competitor for comparison purposes, an alternative is to compare the company’s PE ratio with the PE ratio of the industry, or the PSEi if the company is an index stock.
Sectors
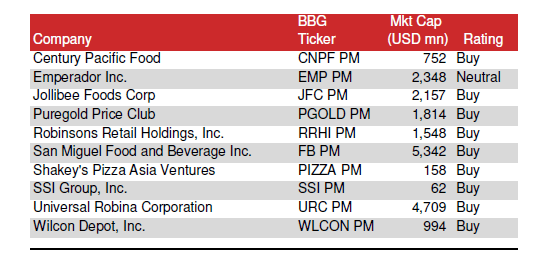
Looking at the PE ratio of the general sector that PIZZA is categorized under can help you understand whether the stock is cheap or expensive vis-à-vis the bigger industry. In this case, BDO Securities houses PIZZA under the consumer sector along with the companies below:

The PE ratio of the consumer sector (as of market close April 21, 2020) is 23.7x. Since PIZZA only has a PE ratio of 12.4x we can see it’s much lower than the overall sector. As we discussed earlier, if you believe the business model of PIZZA will remain intact after the effects of COVID-19 and the company can return to previous levels, the low PE ratio of PIZZA compared to the overall sector may be a good sign for a bullish investor.
PSEi
Alternatively, we can compare the PE ratio of a stock to the PE ratio of the PSEi especially if the company is an index stock.
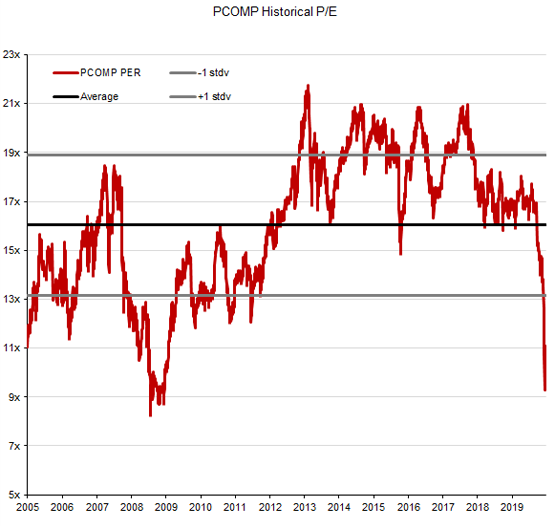
Below is the historical PE ratio of the market going back to April of 2005.

*The above chart shows the PSEi as of April 3, 2020
As you can see, the average PE ratio (thick black line) over the past fifteen years is approximately 16x. With the recent market decline, the PSEi currently trades at a PE ratio of approximately 11x (as of April 3, 2020) which is down from 17x at the end of 2019.
With the current PE ratio of PIZZA being 12.4x versus that of the PSEi’s (comprising of the PSE’s largest and most liquid companies) PE ratio of 11x, how does PIZZA fare?
In summary, when using PE ratios you can compare:
- A company’s current PE with its historical average, or even projected PE ratio, if available.
- Against similar peers or competitors
- Against its sector, or even the PSEi, if an index stock.
The PE ratio is one of the most popular valuation methodologies, but it is not the only one. Be sure to read our other valuation article to learn more. Thanks for reading, and good luck investing this week!
Read our suggested articles below to help you invest with BDO Securities.
How to Find Dividend Paying Stocks with BDO Securities
Disclaimer: This is not a research report. The information, opinions and analysis contained herein are based on sources and data believed to be reliable but no representation, expressed or implied, is made as to its accuracy, completeness or correctness. This material is only for the general information of the authorized recipients. In no event shall BDO Securities or its officers and employees, including the author(s), be liable for any loss/damage resulting from reliance, directly or indirectly, or information found within this report.


