The enterprise multiple takes two popular metrics and uses them to create a multiple that can be compared between companies within an industry. It uses the EV (enterprise value) of a company and divides it by the EBITDA (earnings before interest taxes depreciation and amortization).
Some investors consider the enterprise multiple as a better way to compare companies in different countries, since countries have different tax rates, debt rates, etc. It can also help to compare companies that are in more cyclical industries and have higher capital expenditures.
To understand the enterprise multiple, let’s dissect the two parts of the multiple starting with EV.
Enterprise Value (EV)
One way to think of EV is as a theoretical takeover value of a company. If a company is to be purchased by another corporation, the EV of the company is a much more accurate way to calculate the takeover price than the market capitalization of the company. This is because EV includes important pieces of the business, such as debt. If a company is going to be purchased by another company, the purchasing company should consider the acquisition target’s debt as part of the acquisition cost; EV factors in the debt of that company.
The following are needed to calculate the EV of a company:
Market capitalization
Preferred shares
Minority interests
Total debt
Cash and cash equivalents
First, the market capitalization of a company is the total shares outstanding multiplied by the stock price of the company. For example, if a hypothetical company named Schultz Inc. has 500 million shares outstanding and is trading at P1.00 per share, the total market capitalization of the company is:
Market capitalization = shares outstanding x price per share
Market capitalization = 500,000,000 x P1.00
Market capitalization = P500,000,000
As we can see, the market capitalization of Schultz Inc. is P500,000,000. Let’s think about this number. If a new company called Rich Corp. wants to purchase Schultz Inc., it will need to calculate the price of Schultz Inc. and also factor in the debt and cash/cash equivalents of Schultz Inc.
Assume Schultz Inc. has P200,000,000 of debt and P50,000,000 of cash and cash equivalents. We can calculate the EV of Schultz Inc. as:
EV = Market capitalization + Total debt – Cash & cash equivalents
EV = P500,000,000 + P200,000,000 – P50,000,000
EV = P650,000,000
As we can now see, the EV of Schultz Inc. is P650,000,000. This is significantly higher than the P500,000,000 market capitalization of the company; and thus, the price the company may sell for is P650,000,000 (not P500,000,000).
If Shultz Inc. would happen to have issued preferred shares, this would also have to be deducted from the total value. Likewise, minority interests should be deducted if present. These two additional facets account for the “equity” part of the company that common shareholders have no claim over.
Earnings before interest taxes depreciation & amortization (EBITDA)
When you hear about a company’s earnings, you’re usually hearing about the net income of the company. The net income is the income the company earns after subtracting things like interest expenses, taxes, depreciation, and amortization. When comparing companies within an industry and across countries, many consider the EBITDA comparison to be a more “apples-to-apples”, “like-for-like” type of assessment as compared to comparing net income. It allows investors to compare profits of a company without factoring in things like accounting and financing treatments/practices.
There are a few ways to calculate EBITDA. We will use the following for our computation:
Net income
Interest expenses
Taxes
Depreciation & amortization
First, we will use net income (aka earnings) because they are readily available and should be easy to find. Net income is the result of subtracting interest, taxes, and depreciation/amortization, so we need to find all of these items and add them back to net income to find the EBITDA.
Let’s assume Schultz Inc. has net income of P25,000,000, interest of P5,000,000, taxes of P8,000,000, depreciation & amortization of P10,000,000.
We can use the below formula to calculate EBITDA:
EBITDA = net income + taxes + interest expense + depreciation & amortization
EBITDA = P25,000,000 + P5,000,000 + P8,000,000 + P10,000,000
EBITDA = P48,000,000
Now we can see the EBITDA is P48,000,000. Given that we now know both EBITDA and EV, we can calculate the enterprise multiple of Schultz Inc.
Enterprise Multiple (EV/EBITDA)
We now have everything we need to calculate the enterprise multiple (EV/EBITDA) of Schultz Inc. The calculation is simple now that we have both the EV and EBITDA. All we need to do is the following:
Enterprise Multiple = EV/EBITDA
Enterprise Multiple = P650,000,000 / P48,000,000
Enterprise Multiple = 13.5x
We have computed an enterprise multiple of 13.5x for Schultz Inc. Now it’s time to do a comparative analysis to help us figure out if Schultz Inc. is a buy.
Comparative analysis with EV/EBITDA
Now that we’ve calculated the enterprise multiple, we can use similar comparative methods that we used in our previous PE Ratio article.
We can pursue the following comparative methods:
Compare against historical EV/EBTIDA
Compare against competitors EV/EBITDAs
Compare against sector and index EV/EBITDA
Compare against historical EV/EBITDA
We can look at the past EV/EBITDA and see how it compares to the current multiple.
Schultz Inc. EV/EBITDA 2016 = 15.8x
Schultz Inc. EV/EBITDA 2017 = 17.2x
Schultz Inc. EV/EBITDA 2018 = 20.3x
Schultz Inc. EV/EBITDA 2019 = 19.3x
So far we can see that the average enterprise multiple over the past few years is higher than the current enterprise multiple of 13.5x. This isn’t necessarily a good or bad sign; it just means the company is cheaper right now.
A higher historical EV/EBITDA means that the company is less expensive compared to its historical multiple and a lower historical EV/EBITDA would mean the stock is more expensive compared to its historical multiple.
Compare against competitors EV/EBITDAs
We can select five (5) hypothetical competitors of Schultz Inc. and compare their EV/EBITA’s:
Corona, Inc.: EV/EBITDA = 20.2x
Lock D Corp.: EV/EBITDA = 15.2x
ECQ, Inc.: EV/EBITDA = 21.2x
New Norm Corp.: EV/EBITDA = 10.3x
Sanitization, Inc.: EV/EBITDA = 14.4x
Since EV/EBITDA is a comparative metric, we can compare the above companies to see if Schultz Inc. has a high or a low EV/EBITDA. Since the EV/EBITDA is 13.5x, we can consider the EV/EBITDA to be on the lower end. This means that Schultz Inc. may be undervalued compared to its competitors.
Compare against sector and index EV/EBITDA
We can also view the overall EV/EBITDA of the sector and/or the overall stock market index that Schultz Inc. belongs to. Let’s assume Schultz Inc. trades in the retail sector, and is listed in the Philippine Stock Exchange Index (PSEi):
Retail Sector: Average EV/EBITDA = 18.9x
PSEi: Average EV/EBITDA = 16.2x
Above we can see that the average EV/EBITDA of both the PSEi and the Retail Sector are higher than Schultz Inc. This further strengthens the idea that Schultz Inc. may be undervalued.
Since nearly all of the comparisons above point to an undervalued EV/EBITDA, Schultz Inc. may potentially be a Buy. Of course, you would need to make sure there are no fundamental problems with the company that are reflecting the lower EV/EBITDA. As long as there are no major problems with the company, it could be a potential Buy.
EV/EBITDA using PCOR
Not many companies are valued by BDO Securities using EV/EBITDA. One of the companies we do value using this method is Petron Corp (PCOR). PCOR is in the oil and gas industry which is classified within the industrials sector. Because companies classified as industrials typically operate in highly cyclical industries with large capex requirements, EV/EBITDA is an acceptable method to use. So EV/EBITDA is a good valuation method to use when comparing PCOR to other companies within the industrials sector.
Below you can see a chart comparing EV/EBITDA of PCOR with other companies within the industrials sector.
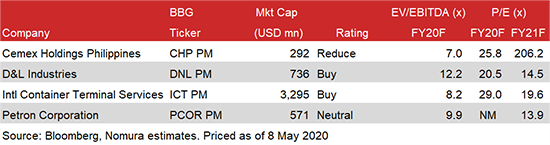
As you can see, all companies above are operating in cyclical industries with high capex requirements. This is one of the reasons EV/EBITDA is a good tool for valuing PCOR; it works as an apples-to-apples comparison of companies which usually have significant depreciation and interest expenses, as well as varying capital structures.
The above shows 2020 EV/EBITDA of 9.9x. The average 2020 EV/EBITDA for all companies is 9.3x, so PCOR has a higher EV/EBITDA and is relatively more expensive than peers.
Another article to help you invest and find stocks with BDO Securities
Dividend Investing with BDO Securities
Disclaimer: This is not a research report. The information, opinions and analysis contained herein are based on sources and data believed to be reliable but no representation, expressed or implied, is made as to its accuracy, completeness or correctness. This material is only for the general information of the authorized recipients. In no event shall BDO Securities
or its officers and employees, including the author(s), be liable for any loss/damage resulting from reliance, directly or indirectly, or information found within this report.