Pattern analysis is a popular tool used by traders to project the future movement of stock prices. The process of identifying chart patterns can be considered subjective in nature and many consider it to be more art than science. That being said, pattern recognition is a highly useful skill that all traders should learn.
This article focuses on the popular patterns used to identify bullish and bearish trends. The bullish and bearish patterns in the article are all associated with continuation patterns and can help identify if a stock may continue in the direction the stock previously moved.
Bullish Continuations
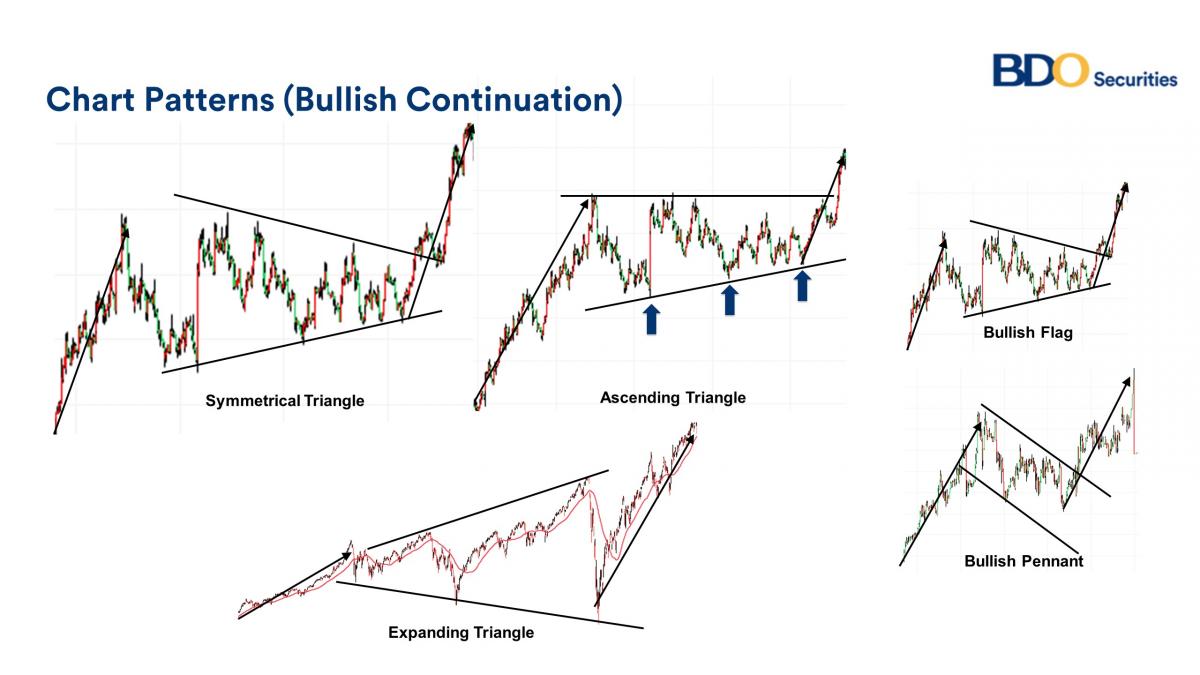
There are five main bullish continuation patterns seen above. As you can see, the prices begin with appreciation, then have a consolidation phase, then a breakout phase. Below you can see more about the five bullish continuations above.
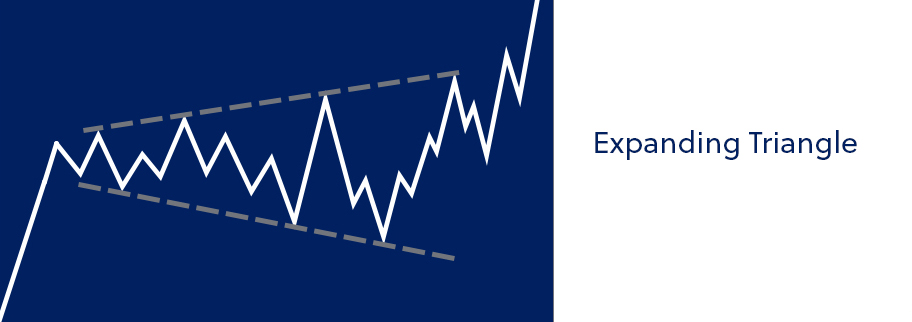
Opposite its symmetrical triangle counterpart, an expanding triangle is a bullish continuation pattern wherein prices expand by reaching higher highs and lower lows over time. This price movement can be viewed as the market becoming “more volatile” with its price range expanding prior to a breakout occurring. This bullish expanding triangle breaks out at the topside.
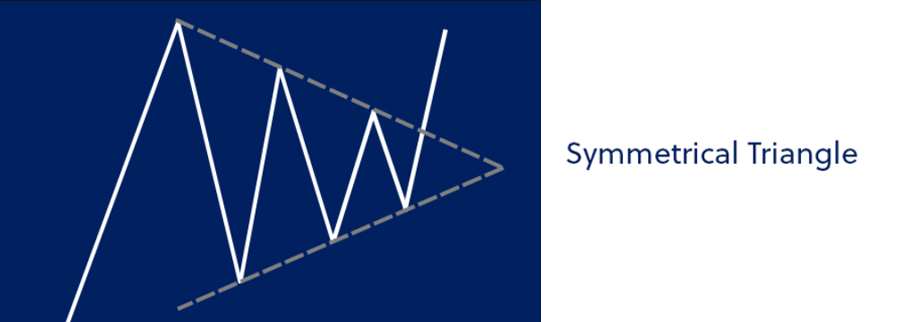
The symmetrical triangle above is a bullish continuation pattern wherein the slope of the triangle is equal or nearly equal. The slopes converge at a point and the above symmetrical triangle is a continuation pattern since it begins with an uptrend and ends with an uptrend.
_______________________________________________________________________________________________
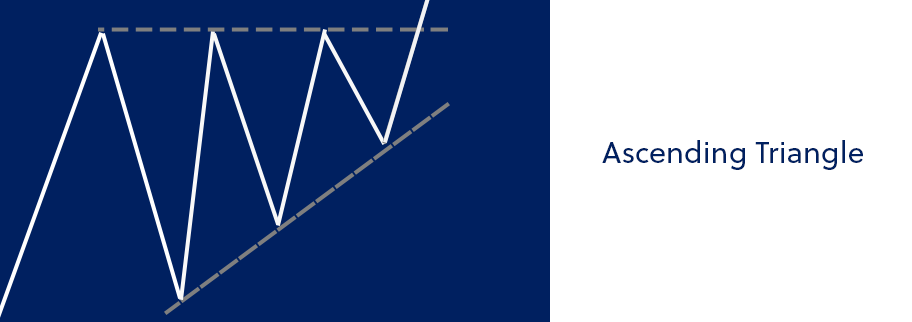
The above pattern shows a bullish ascending triangle. The ascending triangle includes a flat line on the top connecting the peaks and a line with a slope connecting the troughs.
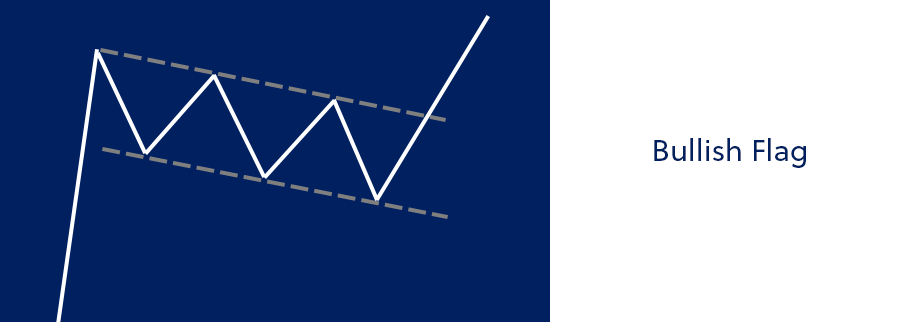
The bullish flag pattern includes a steep uptrend (known as the flagpole) followed by a slight downtrend channel. The flag pattern above ends with an uptrend in price confirming the bullish pattern.
_______________________________________________________________________________________________
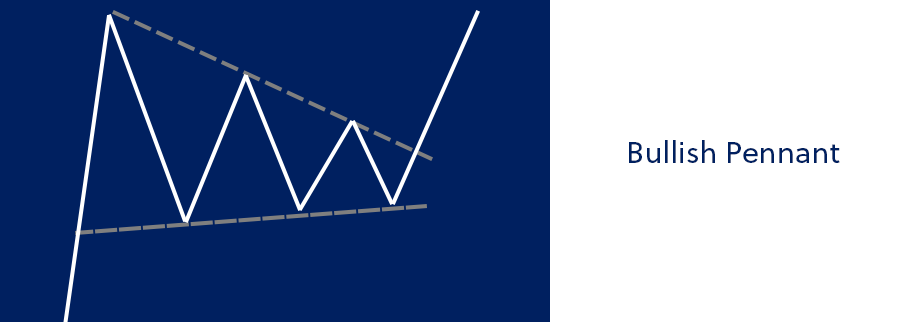
Similar to the bullish flag, the bullish pennant starts with a flagpole (steep uptrend in price). The difference between the bullish flag and bullish pennant is that the bullish pennant has two converging lines while the bullish flag includes parallel lines creating a channel.
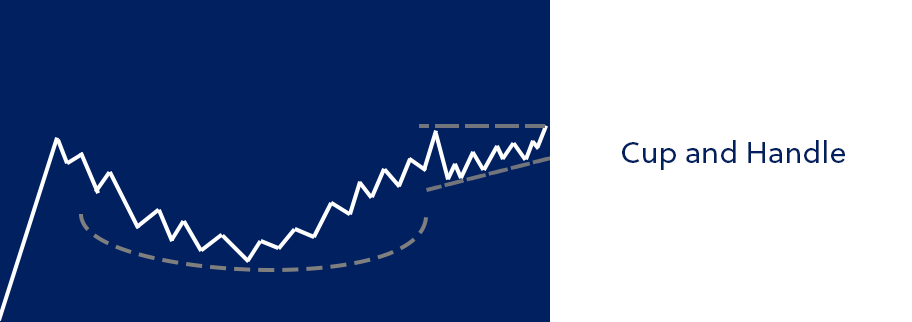
The cup and handle begins with an uptrend in price followed by a longer consolidation phase. The consolidation phase is then followed by an uptrend and then a shorter consolidation phase followed by another breakout.
Bearish Continuations
_______________________________________________________________________________________________
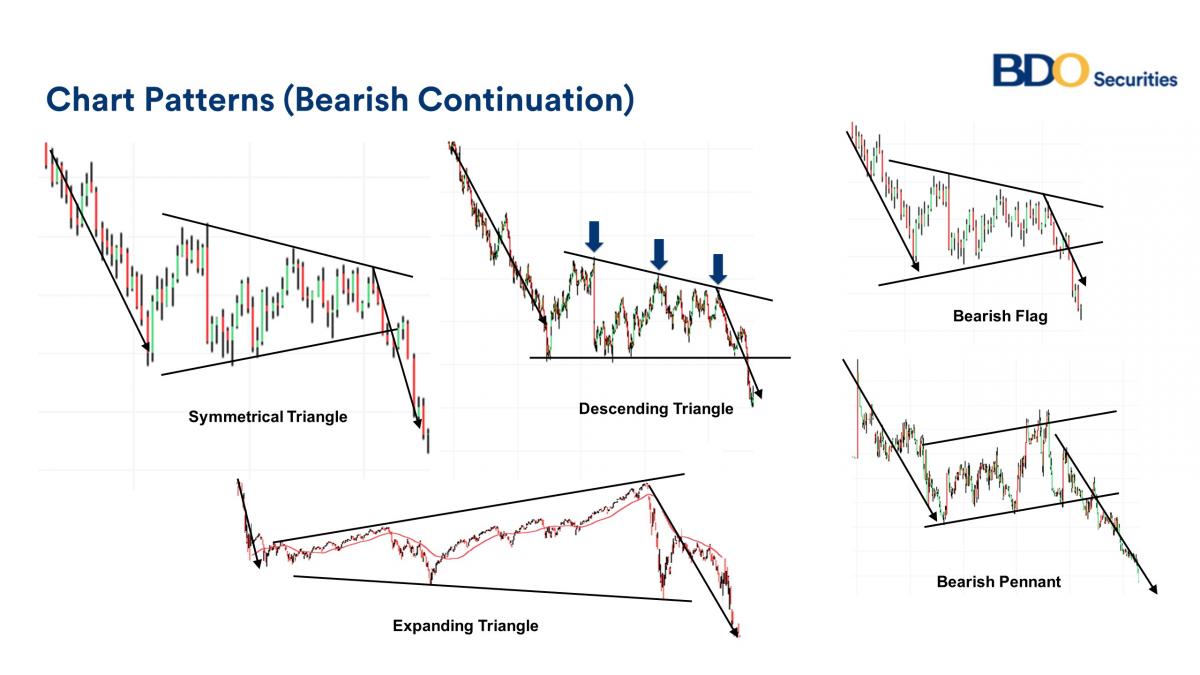
There are five main bearish continuation patterns seen above. As you can see, the prices begin with a decline in prices, then a sideways phase, then a breakdown phase. Below you can see more about the four bearish continuations above.
_______________________________________________________________________________________________
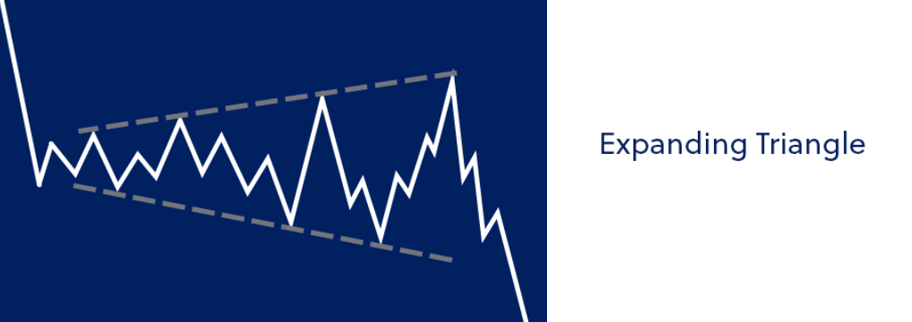
Opposite its symmetrical triangle counterpart, an expanding triangle is a bearish continuation pattern wherein prices expand by reaching higher highs and lower lows over time. This price movement can be viewed as the market becoming “more volatile” with its price range expanding prior to a breakdown occurring. This bearish expanding triangle breaks to the downside.
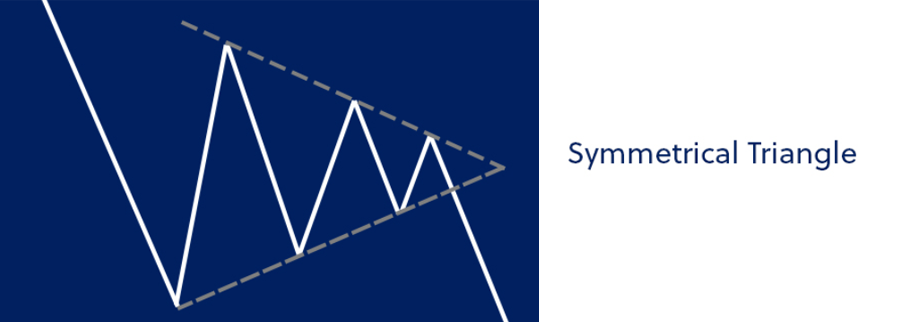
The symmetrical triangle above is a bearish continuation pattern wherein the slope of the triangle is equal or nearly equal. The slopes converge at a point and the above symmetrical triangle is a continuation pattern since it begins with an downtrend and ends with an downtrend.
_______________________________________________________________________________________________
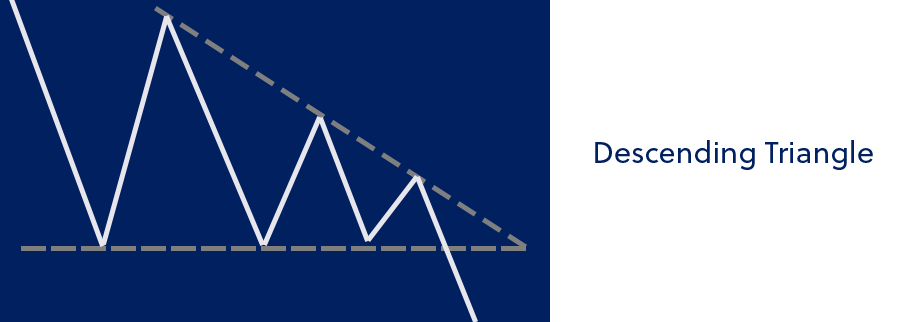
The above pattern is a bearish descending triangle. The pattern includes a flat line on the bottom connecting the troughs and a line with a slope connecting the peaks. This pattern begins with a downtrend and continues with a downtrend after some consolidation.
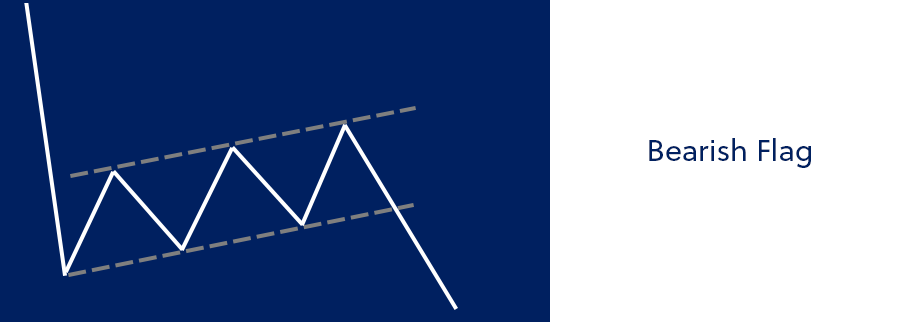
The bearish flag pattern includes a steep downtrend (flagpole) followed by a slight uptrend channel. The flag pattern above ends with an downtrend in price confirming the bearish pattern.
_______________________________________________________________________________________________
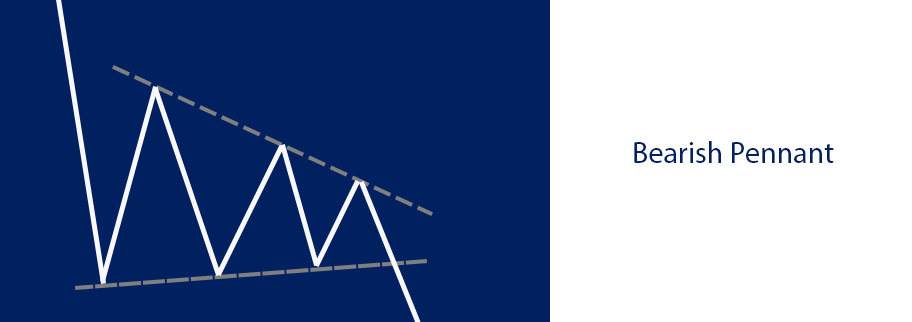
Similar to the bearish flag, the bearish pennant starts with a flagpole (steep downtrend in price). The difference between the bearish flag and bearish pennant is that the bearish pennant has two converging lines while the bearish flag includes parallel lines creating a channel.
We highly suggest watching our video regarding risk management here: Risk Management Video


